
Measuring Value is Important
Unless you’ve been living under a rock, it’s no doubt you’ve heard the term “Copilot” in the last year more times than you can count. True to form, Microsofts branding has ensured that the word Copilot has become synonomous with Microsoft and AI. At the center of all this buzz is Copilot for Microsoft 365.
I won’t go into an in depth description of Copilot for Microsoft 365 here because most people have heard all about Microsofts new favourite product. At a (very) high-level, Copilot for Microsoft 365 injects the familier GPT model experiences that people have with something like Chat GPT, directly into the tried and tested productivity suite (Teams, Word, PowerPoint, Excel etc..).
Cards on the table, I love Copilot for Microsoft 365. Personally I use it daily and when it’s taken for what it is (a productivity enhancement), it delivers on it’s promise. The only issue some organisations have is the price tag. At $30 per user per month, Copilot licensing isn’t an insignificant investment for a business.
That being said, I strongly believe that Copilot delivers a productivity boost that more than justifies the cost. The issue then becomes, how to measure this benefit to make sure that we, as an organisation, are seeing the value return we expect and justify the spend.
The standard approach to measuring the return on investment for Copilot is to build out the key use-cases, which become indicitive of a wider benefit. Microsoft provides value calculators to translate time saved on tasks into financial amounts. This is a solid approach and there are many articles online with tips on how to do this.
The other side of measuring Copilot is the technical reporting. While building use cases and value calculations is great, we also want to measure usage to ensure that we have provided enough support and training to our people to enable them to get the most out of Copilot.
Measuring Usage With the Copilot Dashboard
There are a couple of ways we can measure Copilot usage to get a full picture of the benefit to the organisation. First, Microsoft have included the Copilot Viva Insights Dashboard with all Enterprise or Business plans.
The Copilot Dashboard is available through the Viva Insights app in Teams. From the Insights App, there are four areas of the Copilot Dashboard:
- Readiness
- Adoption
- Impact
- Learning
The readiness section is useful when planning a pilot deployment of Copilot, understanding who is ready to use Copilot. The other interesting part of this section is licensed vs active employees. I’ve taken Figure 1 below from the Microsoft Documentation but even there, we can see only 64% of users who are licensed for Copilot are activly using it. “Activity” is defined as a user who has interacted with Copilot for Microsoft 365 during the report time period (trailing 28 days). So in this case, out of 2,267 users licensed for Copilot, a whopping 816 aren’t using it!

This doesnt always mean those users need to have their license removed (although sometimes that is the case), it can often mean that the organisation has not provided enough training and adoption services to help Copilot users adapt to the new technology.
Speaking of adoption, the Adoption section (Figure 2) of the Copilot dashboard breaks down usage on a per-app basis. This information can futher refine the areas we may need to invest in from a training perspective. Like any Microsoft 365 rollout, people can gravitate to what they are familier with so it’s the job of the organisation to guide people in experiencing the full value of the tools at their disposal.

The Impact section of the Copilot Dashboard (Figure 3) shows summaries of the activities which took place within the environment. This is great for reporting back progress after a deployment and measuring active usage.

Admins can also perform sentiment surveys and pull that data directly into the Copilot Dashboard as outlined here.
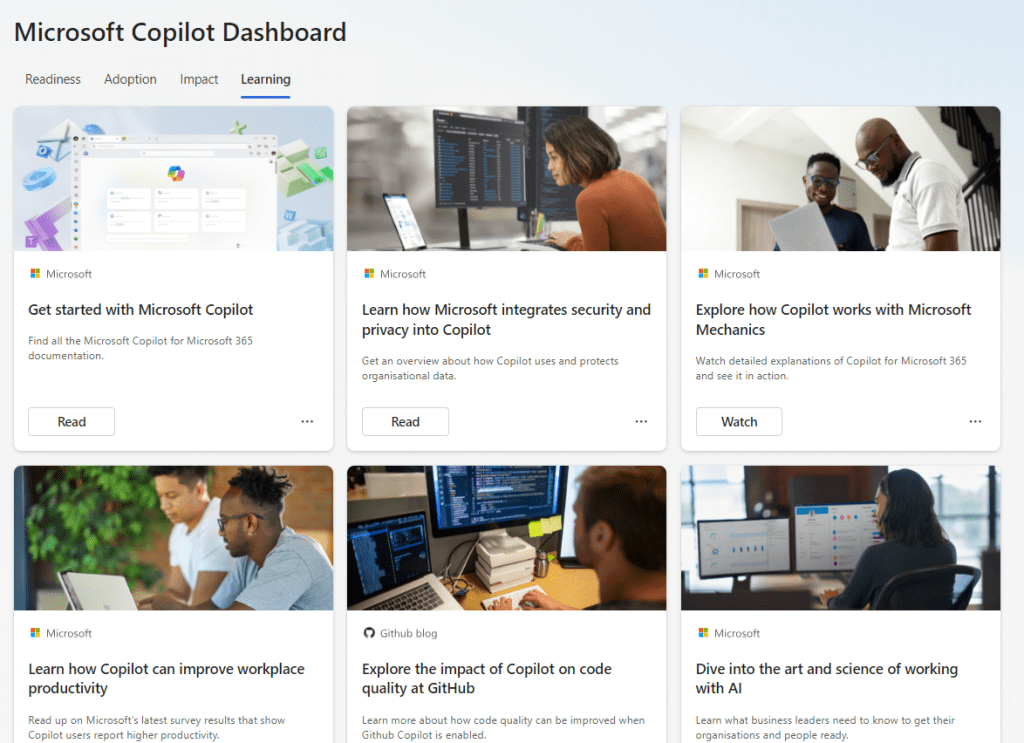
Finally the Learning section (Figure 4) provides tonnes of reading materials and videos to help people understand and explore Copilot for Microsoft 365. Much of this content is available in https://adoption.microsoft.com so I recommend checking that site out to learn more about Copilot and Adoption.
Retrieving Copilot Logs
Interaction with Copilot for Microsoft 365 is an activity just like any other in Microsoft 365. Like any activity, Copilot interactions are logged. Before people get worried about all of their prompts being made available to a nosey admin, let’s look at what is logged.
A Copilot interaction consists of a few pieces of data: TMetadata such as the users name, app used and timestamp, the query sent, and the data retreived. It’s important to note that the audit log in Microsoft 365 does not contain the query or the data retreived. This content is stored for various purposed but is actually stored within the users own mailbox and accessible only via a Content Search or eDiscovery.
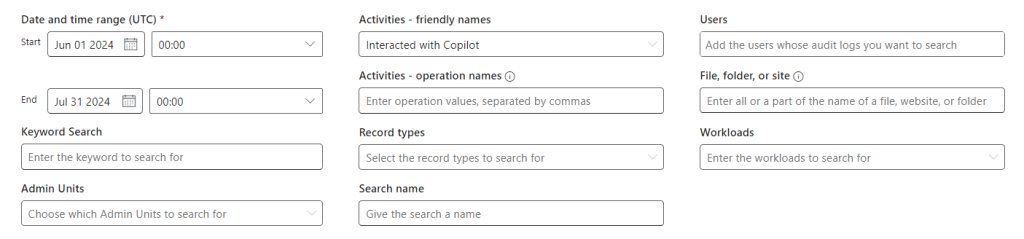
From an audit log perspective, admins can run an audit log search from the Microsoft Purview Compliance Center, filtering by the activity “Interacted with Copilot” (Figure 5) to return all instances of Copilot interaction with Copilot. I would assume this is the data that the insights dashboard is based on also.
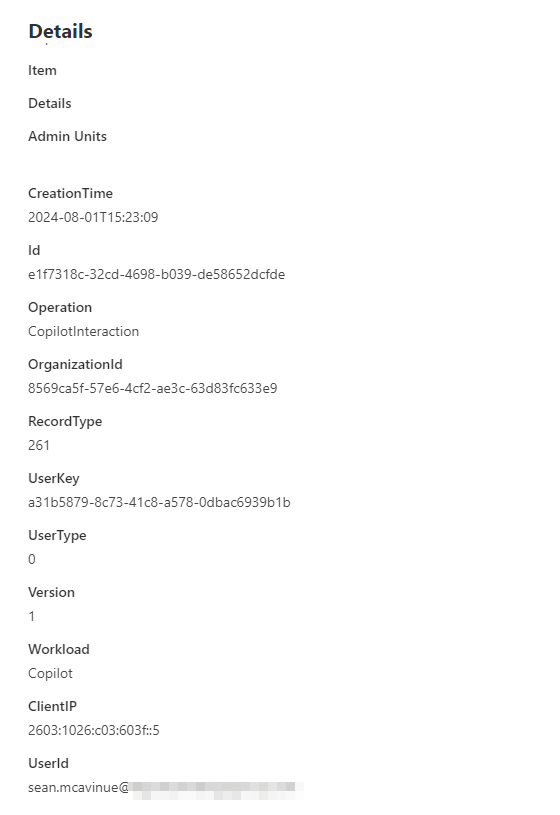
Once the scan runs, the results can be reviewed in the web (Figure 6) or downloaded to be analyze in Excel.
Summary
There are a number of ways to measure Copilot value, the technical aspects of reporting are only part of the picture but it’s useful to give a fully rounded view of usage. As I mentioned, low usage is not always that Copilot won’t help your organisation, but may be indicitive of a need for a stronger communications, adoption and training plan for your rollout.
