With the recent public release of the Microsoft 365 Productivity Score. It has never been easier to assess your organization’s adoption of Microsoft collaboration tools, identify areas for improvement and plan to help users get the most out of the tools available.
The productivity score is a great baselining tool in the same vein as the Secure Score and Compliance Score. Giving a numerical value based on a wide set of statistics, along with suggestions for improvement.
Enable the Productivity Score
The first step to understand how Microsoft 365 tools are used in your organization is to enable the tool. This can be done from the Microsoft 365 Admin Center by navigating to ‘Reports’ -> ‘Productivity Score’. From here, we can enable the tool, this might take up to 24 hours to finish, then we can start using it.
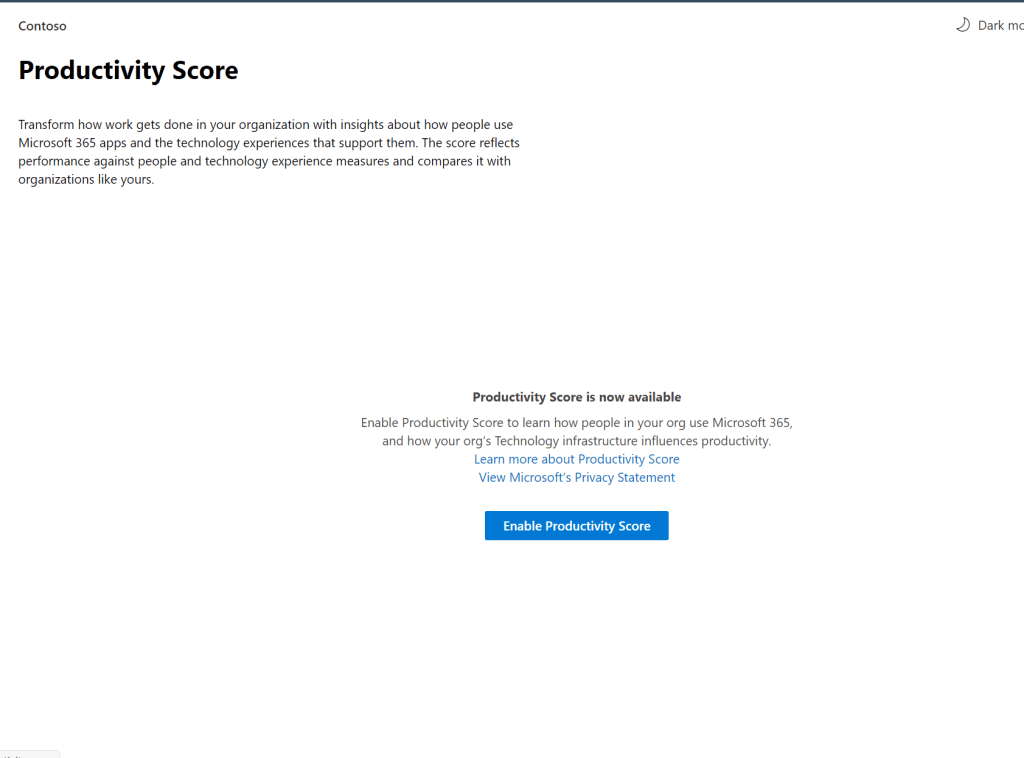
Once the Productivity Score dashboard is enabled, it will show up in this section of the Admin Center.
Score Breakdown
The overall Productivity Score is broken down into two overall ‘buckets’. The total score is the sum of the ‘People’ score and the ‘Technology’ score. You can track your score against the benchmark set by similar organizations.
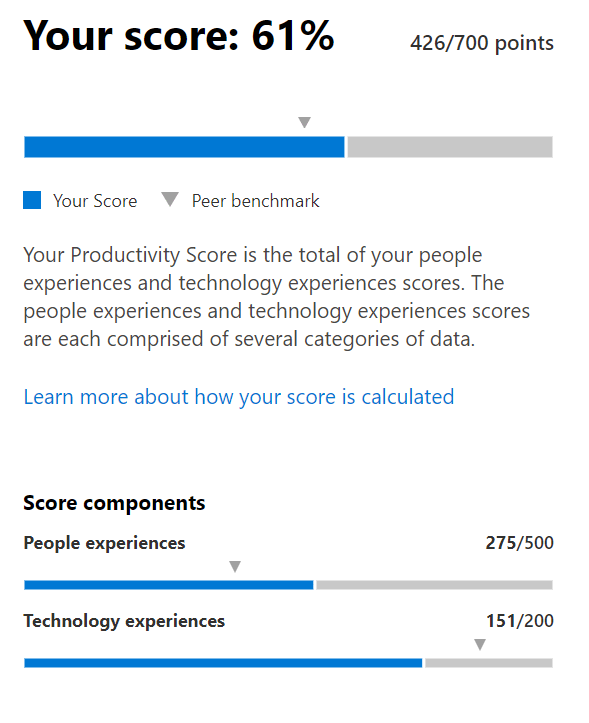
This provides an ‘at a glance’ metric of how the Microsoft 365 toolset is being used in our organization. Along with the current score, we also see how our score has changed over time, this gives us insight into the usage trend in the organization.
People Score
The ‘People’ Score helps us track how our users are leveraging the tools available to them across the various classifications (‘Communication’, ‘Meetings’, ‘Content Collaboration’, ‘Teamwork’ and ‘Mobility’).
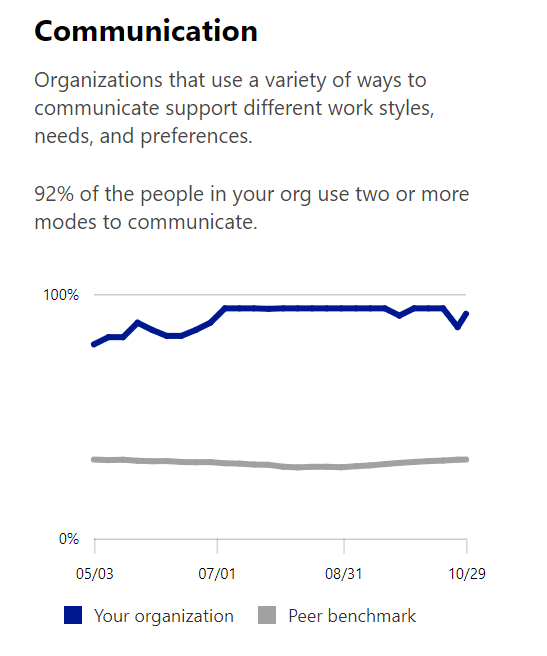
We can dive into one of these classifications to see the metrics that make up our score in a particular area. In ‘Communication’ for example, we can see the different methods our users are using to communicate.

For each metric, we can view content such as videos and articles to help promote the particular method of communication. This gives us access to some prepackaged user training and communications which can help maximizes the utilization.

We can also see a per-user breakdown of active communication methods, allow us to identify areas of the business that need the most help.
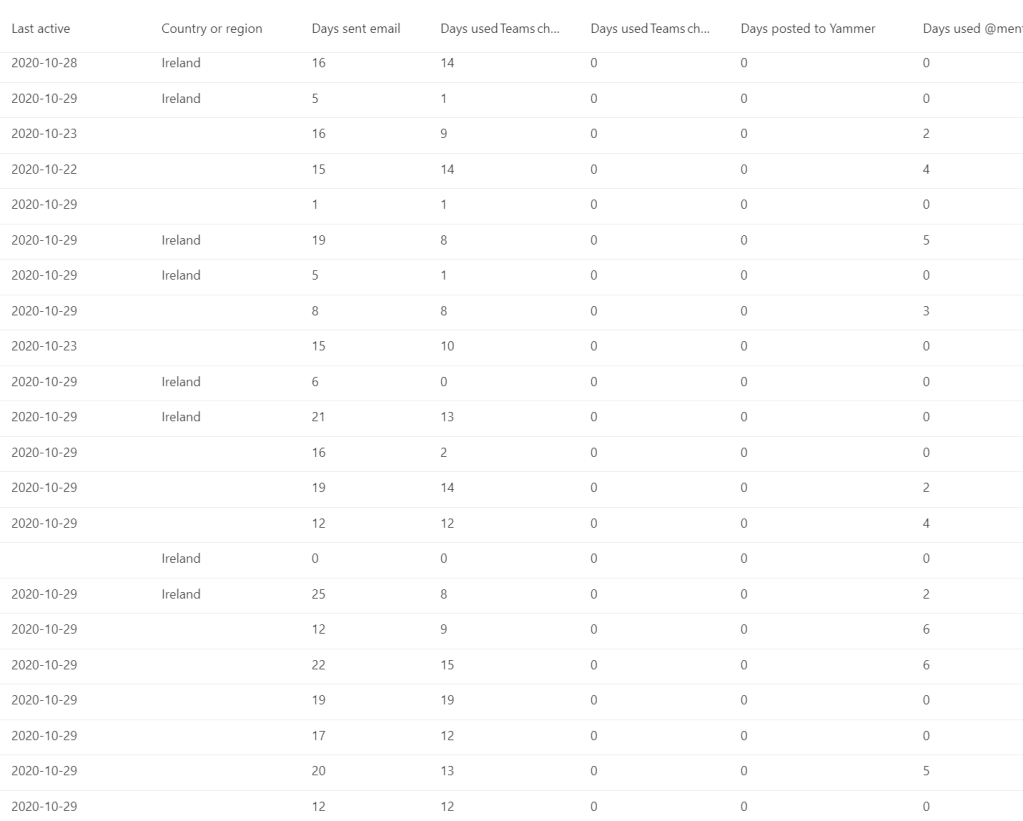
Using the resources in the ‘People’ score, we can easily get a view of how the tools are being used, and by who, and guide our adoption and change management efforts efficiently. In the above examples we can see that our efforts should focus on promoting and providing materials around Yammer much more than Teams chat. We can also see a subset of our users are actively using ‘@ mentions’ however some users aren’t, despite active Teams chat usage.
Technology Score
In our ‘Technology’ score, we can see how the Technical aspects may be affecting our user productivity. In Technology, we see Endpoint Analytics from Microsoft Endpoint Manager (this needs to be enabled), The impact of Network Connectivity and the health of our Microsoft 365 Apps.

In the Microsoft 365 Apps health section for example, we can see the versions of the Office apps our users and connecting with and the associated update channels.
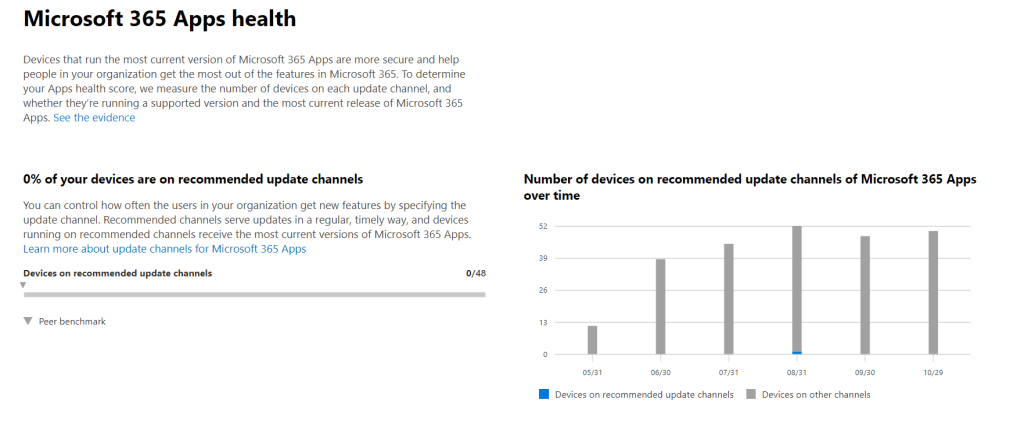
In this example, we can see quite number of our users have unsupported versions of the Microsoft 365 Apps suite and the update channel is configured to ‘Semi-Annual’. This will
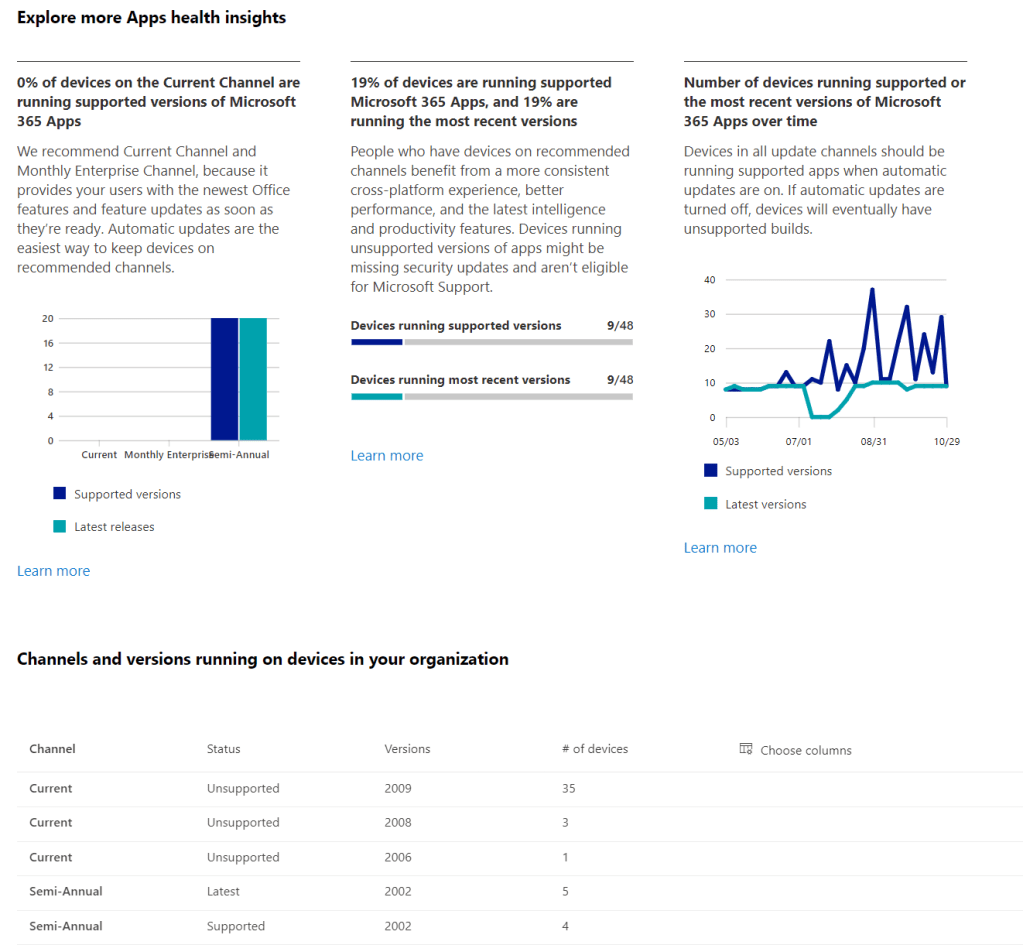
As with the ‘User’ score, we can dive into some useful resources around how to manage and improve this baseline, which will in turn increase our total score.

Summary
As with the Secure Score and Compliance Score, I do recommend that these metrics are taken with a pinch of salt and context is considered before circulating the score. For instance if corporate structure or policy blocks a large group of our users from using Teams, our score there will always be lower. If licensing models or technical restrictions dictate we are using Office 2019 in our organization, that will obviously affect our score.
The Productivity Score is a great addition to the toolset, providing some quick insights and prepackaged metrics that are easily consumed at C-Level in our organization. Overall it is nice to have this information readily available but please don’t rely on any of the Microsoft ‘Scores’ to accurately depict the nuances of your organization.

Pingback: Microsoft Are Removing User Data From The Productivity Score Dashboard – Admin Sean Mc