
This post is part of the overall MS-500 Exam Study Guide. Links to each topic as they are posted can be found here.
This post will cover the following exam topics listed under the “Configure and Analyze Security Reporting” section:
- Plan for custom security reporting with Graph Security API
- Use secure score dashboards to review actions and recommendations
- Configure alert policies in the Security & Compliance admin center
Plan for Custom Security Reporting with Graph Security API
The Microsoft Graph API is an extremely powerful tool for both monitoring and managing your Microsoft 365 environment. The Graph Security API in particular focuses on the security incidents, alerts, configuration etc. in the environment.
For anyone who is familiar with querying Graph API then this will be familiar and I do post regularly about different tasks we can covert with Graph API: Graph API – Sean McAvinue
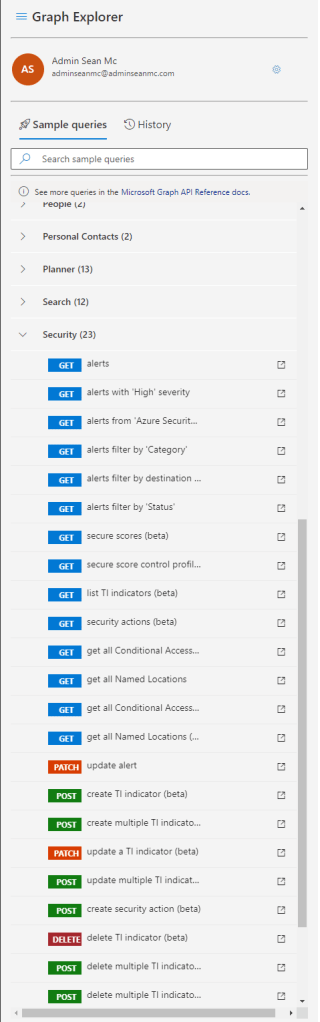
For anyone new to Graph, the best place to get started is using the Graph Explorer. In the Graph Explorer we can run some test queries on some standard user data or use the “Sign in to Graph Explorer” option to connect to our tenancy:

Once signed in, scroll down the sample queries pane to the Security section. This section contains a subset of the available Security Graph queries available.
To run a query in Graph Explorer, let’s take for example the “get all Conditional Access Policies query. Click the sample query to copy it to the query bar at the top. Here we will see the URI needed to query all Conditional Access Policies.

Click “Run Query” to run the sample and view results in the “Response Preview” pane.

Alone this data is nice to have but not a huge amount better than just checking the portal for the settings. The real benefit comes with integrating solutions and automations with Graph to interpret and manage our environment. For example, a lot of third party monitoring and SIEM solutions support Security Graph integration. Let’s take another example:
Let’s first run the sample query to get “Alerts filtered by status”. In the query pane, we can see that the status that is filtered here is “NewAlert”.

Running this query returns all new alerts in our environment.

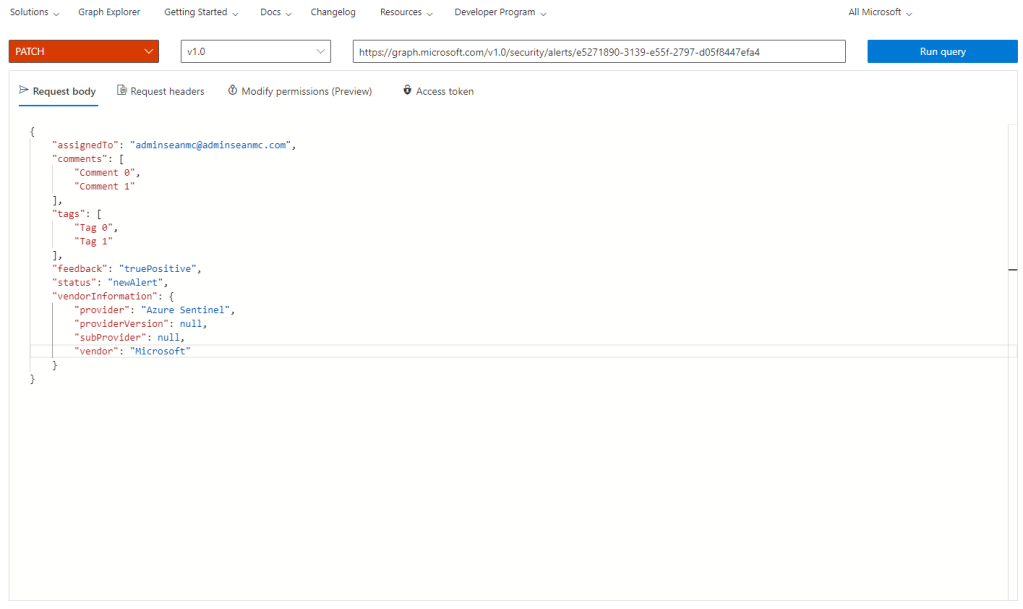
We can then use this information, along with any logic we have programmed into our solution connecting to Graph to update these alerts by using the “Update Alert” PATCH sample.

Clicking on the sample query will show us the following URI:

To update a specific alert, we need to replace the {alert-id} value with the ID of the alert we are querying. If we take the ID from the first alert that showed up in our results above, we can use the “Request Body” pane to update the alert, in the below example, we are assigning the alert to “adminseanmc@adminseanmc.com”.
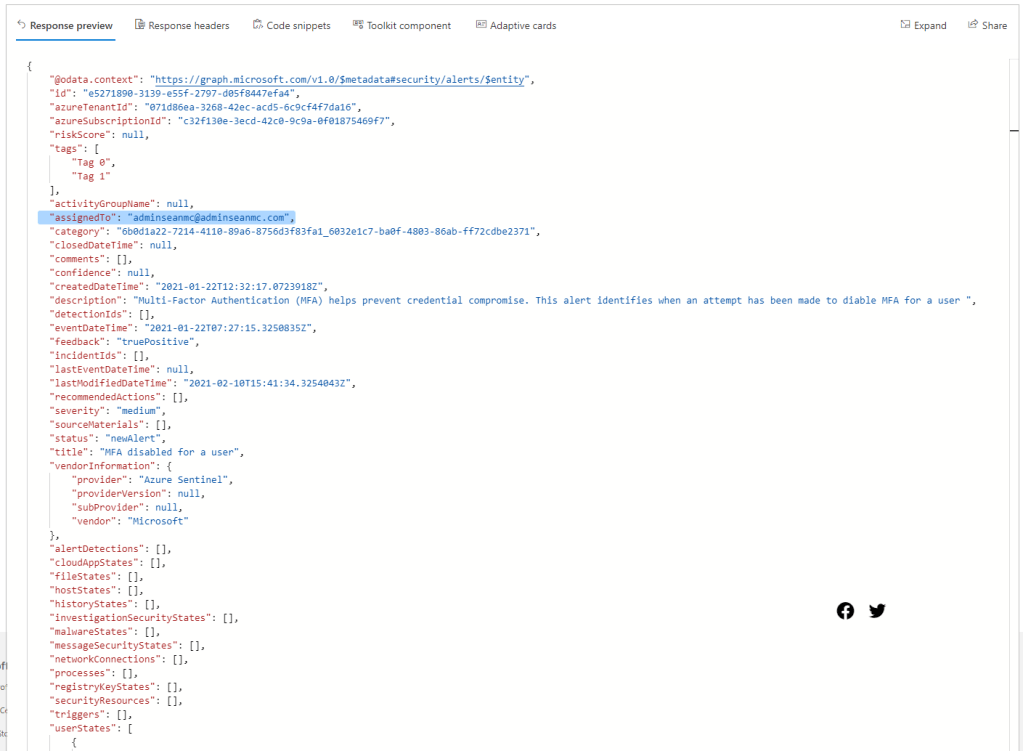
Running the above query will update the assigned user in the Security Alert. We can then run the following “GET” query to return the details of the alert where we can see the updated “assignedTo” attribute.

Using the Graph API is a fantastic way to manage the massive amount of data and create custom workflows and automations. It also provides a very flexible base for third party integrations to help enhance the depth at which the Microsoft Cloud Security tools can be made visible and manageable.
Use Secure Score Dashboards to Review Actions and Recommendations
The Microsoft Secure Score dashboard is a tool which allows us to measure our configuration based on a set of Microsoft best practice recommendations and receive a “Score” based on how in line our environment is with best practice. As an aside, I posted recently with a handy script to post Secure Score entries into a Microsoft Planner instance, this uses Graph API which we spoke about above to pull the details from Secure Score and create a plan from it.
To open the Secure Score dashboard, open up the Microsoft 365 Security Portal and select the “Secure Score” section.
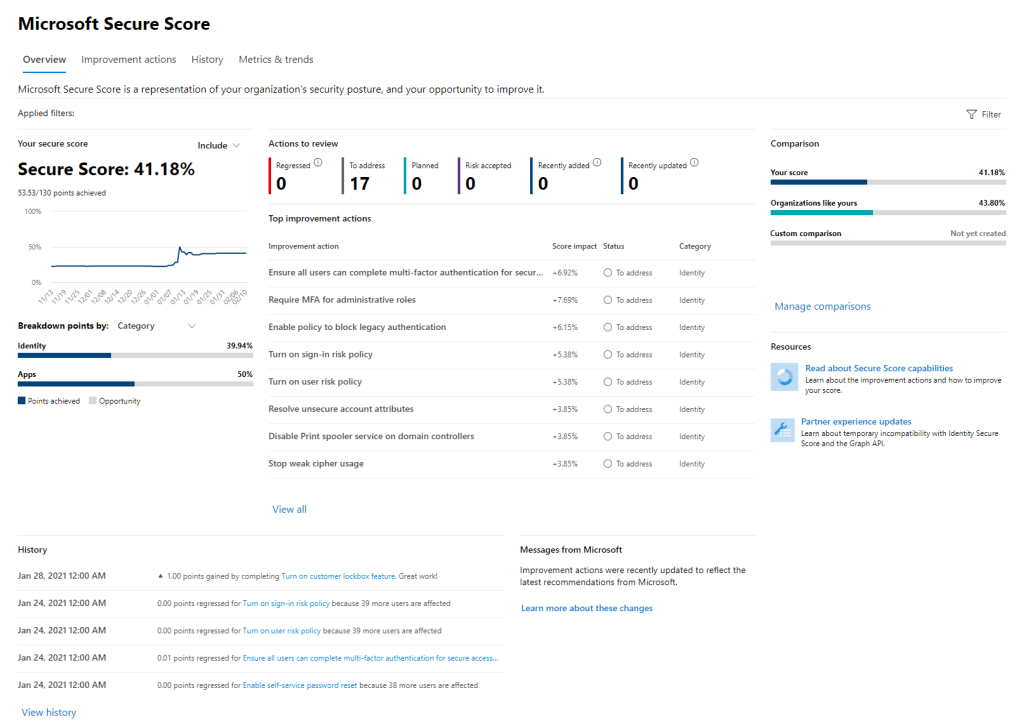
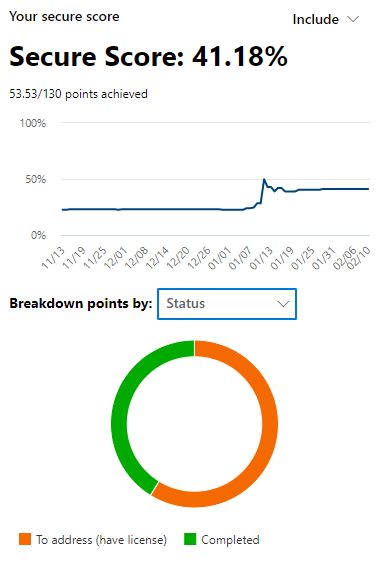
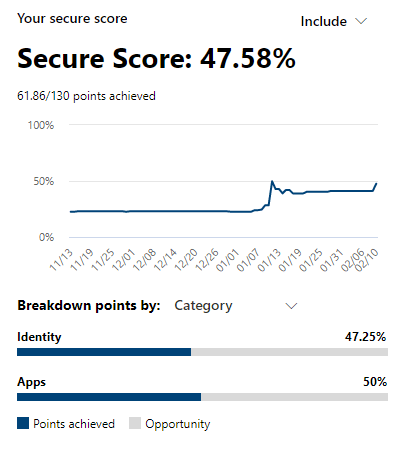
On this page we can see a lot of data in a single pane. Our Secure Score in itself, is the calculated score based on the features and controls we have enabled in our environment. This can be broken down by category or status.
Next we can see the list of Action to review. These are outstanding recommendations which we haven’t implemented yet or addressed otherwise.

We can click on the “view all” option to see the expanded list of these recommendations.

Selecting any of the actions will open up the action page for that particular entry. Below we can see all of the detail associated with the entry for “Require MFA for Administrative Roles”.

From here we can view steps for implementation and update the status of the action to track it along with any notes we may want to add. There are times when implementing the Secure Score recommendation is not viable in our environment. For instance, if we have all users authenticating via ADFS, with third party MFA enforced there, then our MFA requirements are already met, just not visible to Secure Score. In this case we can update the status to either “Resolved through a third party” or “Resolved through alternate mitigation” to signify that we have met this requirement and should receive the added score associated. We can also choose to accept the associated risk if we have a business requirement or justification to not implement the action.

On the overview page we will see that our score has been adjusted to account for us meeting this requirement.
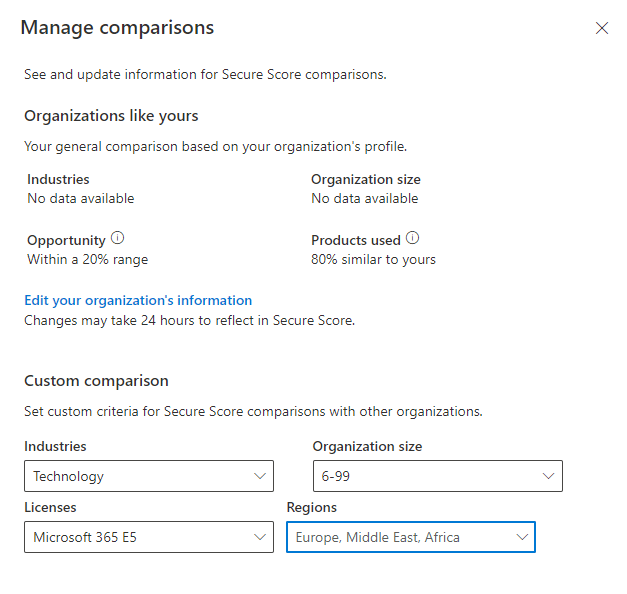
Also on the overview page, we can see a comparison of similar organizations scores so we can get a sense of how we compare to other organizations.

To ensure this is accurate, make sure to click “Manage Comparisons and update the organization information to reflect the organizations industry, size, license type and region.
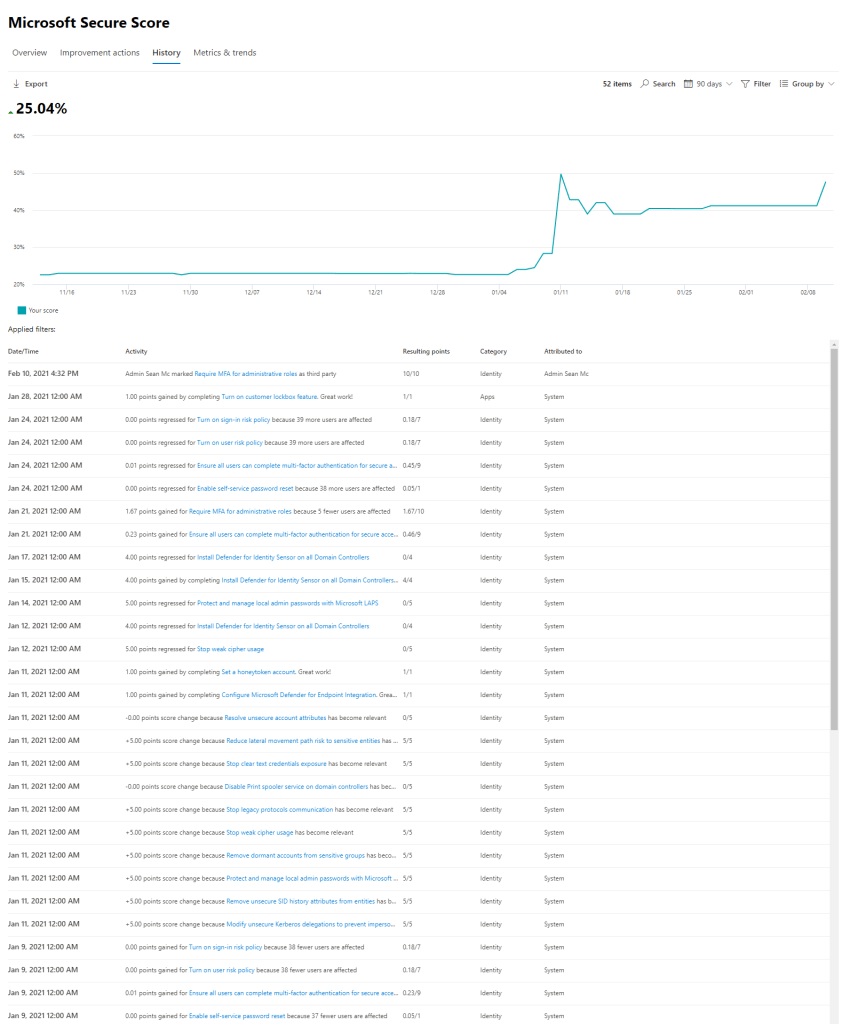
Next, we can see the history of our Secure Score, this shows us the changes that have been made over time and how they have affected our score. This can be a great graph to show the evolution of the tenant from a security perspective.
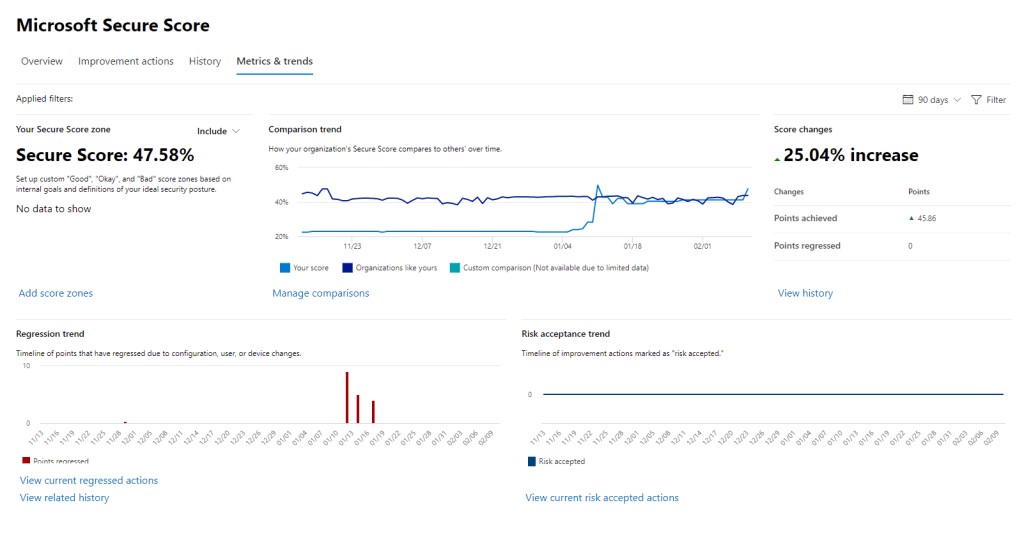
Finally we can open the “Metrics & Trends” page to view a high level representation of the progression of our score over time along with any regression or risk acceptance that may have occurred.
Secure Score is a fantastic guideline for securing a Microsoft 365 environment. It is absolutely worth focusing on improving our security posture and score. I need to call out that it is still just a guideline, it should not be the only consideration for securing the environment and does not replace appropriate risk management and security controls outside of the improvement actions.
Configure Alert Policies in the Security & Compliance Admin Center
We’ve already looked at how we can view and manage alerts that are triggered in the Security & Compliance Admin Center, but what if the alerting we are getting doesn’t meet our particular requirements. The built in alerts cover a lot of what we would generally want to know about and respond to but when we want to monitor something outside of the standard, we can use custom Alert Policies to define the alerts we get.
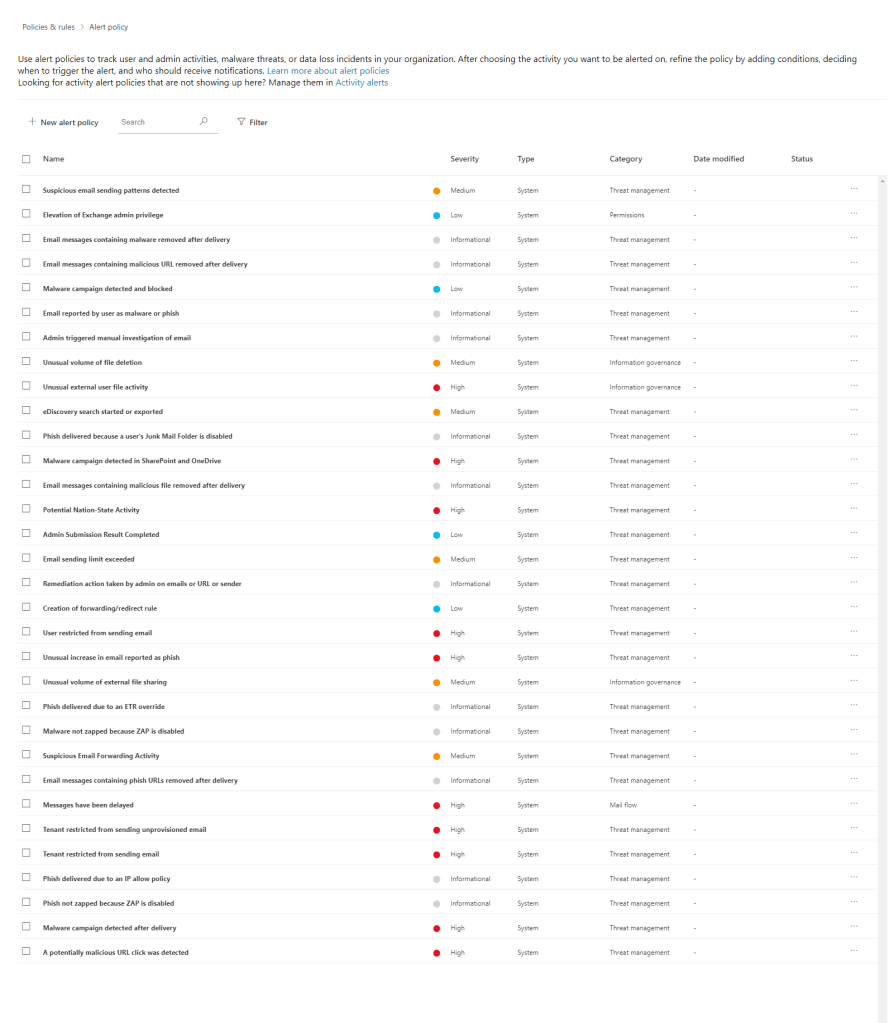
To create an alert policy, open up the “Policies & Rules” -> “Alert Policy” section of the Security Center. Here we will se a list of all the active alert policies in our organization.
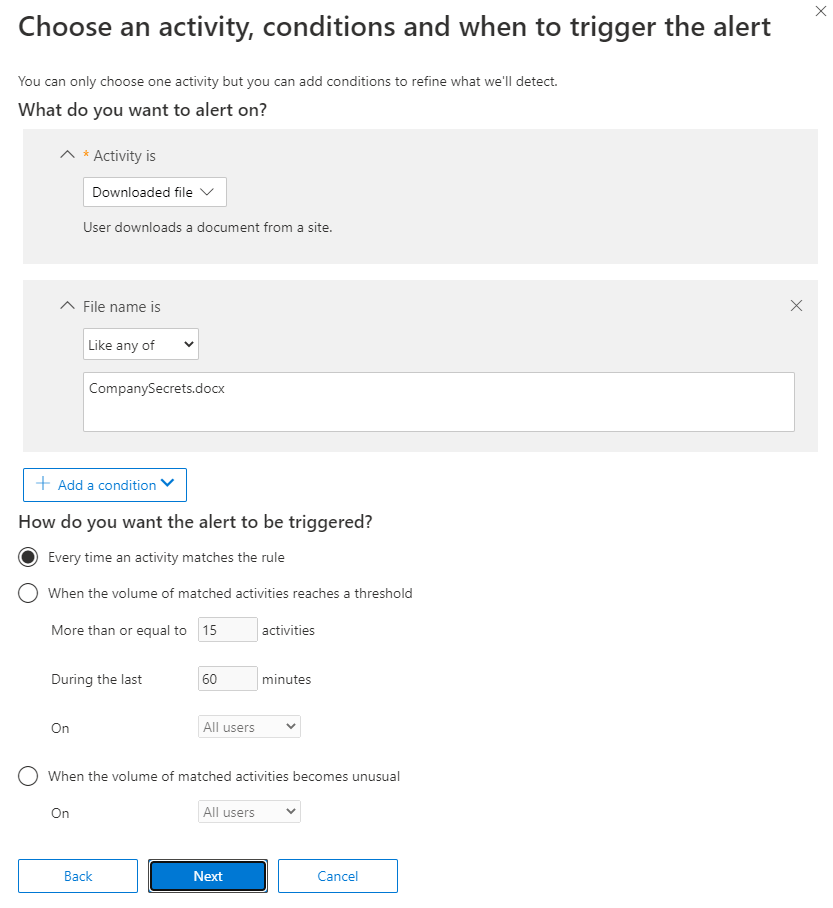
To create a custom policy, click the “New Alert Policy” button. For this example, let’s say we want to create an alert for whenever someone downloads a particular file that contains sensitive information named “CompanySecrets.docx.
Give the policy a name, description, severity and category and click next.

Configure the criteria for the alert and how often you want to trigger an alert.
Select the recipients and limit for email alerts.

Finally, confirm the alert should be turned on right away and click finish to save.

This alert will now monitor activity along with the default alerts we’ve previously looked at.
Summary
In the last two posts we’ve looked at the different ways we can monitor on, improve and alert on behaviour in our environment. This section of the exam deals mostly with this functionality and how we can manage all of the features we’ve seen so far on a day to day basis. In the next post we’ll be looking at how we can use audit logs to get a view of the behaviour and trends in our environment and track down particular activities.
For more information on the contents of this post, check out the below links.
Graph Explorer – Microsoft Graph
Microsoft Graph Security API overview – Microsoft Graph | Microsoft Docs
Microsoft Secure Score – Microsoft 365 security | Microsoft Docs
Alert policies in the security and compliance centers – Microsoft 365 Compliance | Microsoft Docs

Pingback: Study Guide Series – Exam MS-500: Microsoft 365 Security Administration – Sean McAvinue
Pingback: Study Guide Series: Exam MS-500 – Manage and Analyze Audit Logs and Reports – Sean McAvinue