
This post is part of the overall MS-500 Exam Study Guide. Links to each topic as they are posted can be found here.
This post will cover the following exam topics listed under the “Monitor Microsoft 365 Security with Azure Sentinel” section:
- Configure playbooks in Azure Sentinel
- Manage and monitor Azure Sentinel
- Respond to threats in Azure Sentinel
Configure Playbooks in Azure Sentinel
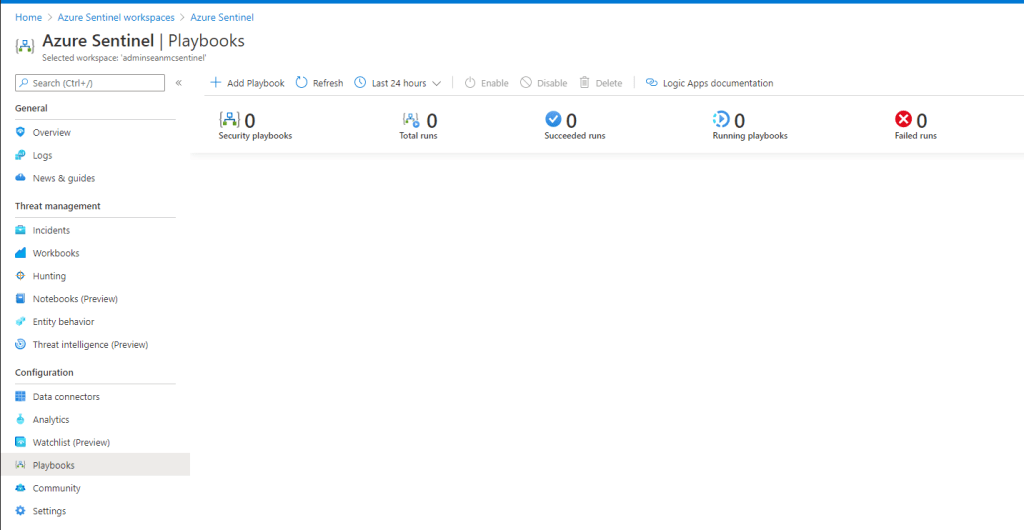
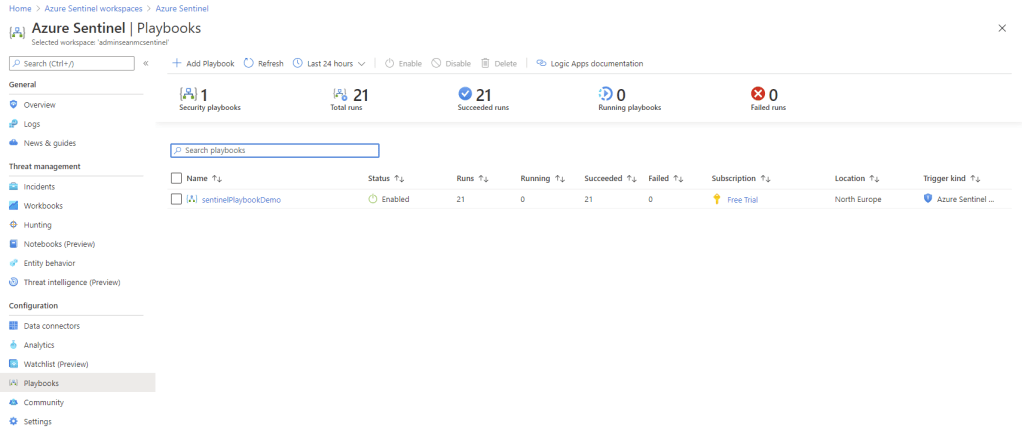
In the previous post we configured Azure Sentinel and integrated our Office 365 service, with the configuration in place, we can now look at how we can leverage Sentinel. The first thing we will look at is configuring Playbooks. Azure Sentinel Playbooks are essentially a set of steps, based on Logic Apps, which can be defined to automate the response/remediation of alerts. To get started, open up the “playbooks” blade in the Azure Sentinel instance. Here we will see any playbooks we have in place and we can create a new playbook by clicking the “Add Playbook” option at the top of the page.
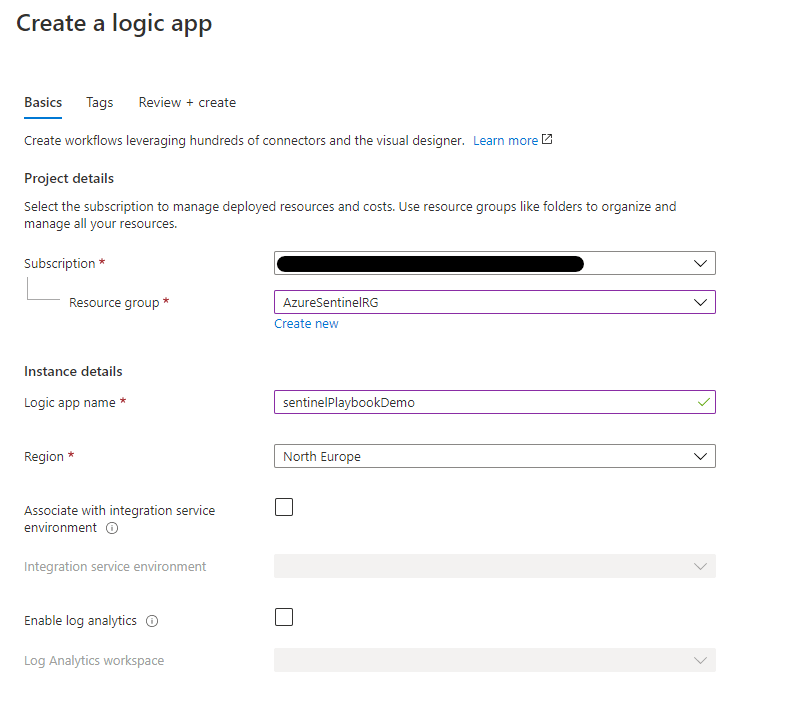
Adding a playbook will bring us to the “Create a Logic App” page, here we need to detail the usual Azure resource requirements like subscription, resource group, region and name. Fill in the relevent details and click “Review + Create” to continue, then “create” on the summary page.
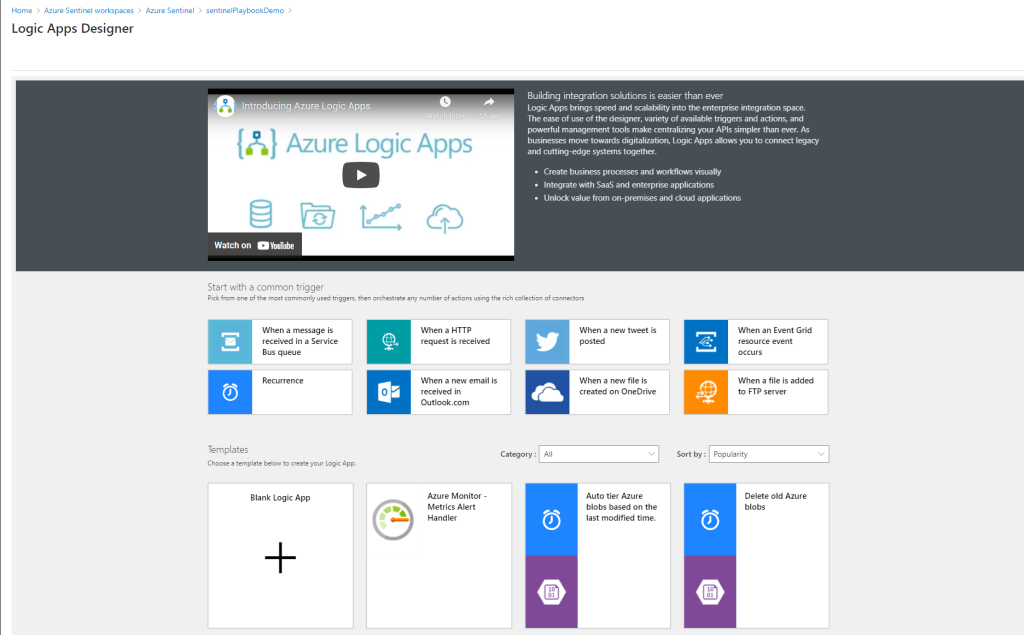
Once the Logic App is created, click “Go to Resource” or navigate to it to open the Logic Apps Designer. This is the same as setting up any Logic App so select the “Blank Logic app” template.
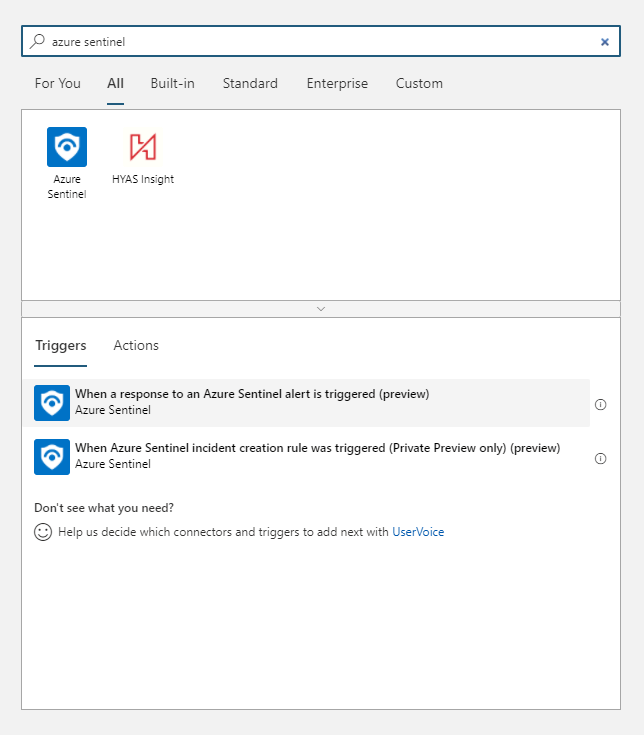
To start our playbook/Logic App, we need to define the right trigger, search the triggers dialog for “Azure Sentinel” and select the trigger “When a response to an Azure Sentinel alert is triggered“
We then need to connect our app to our tenant, on the Sentinel step on the designer page, select the correct tenant in the drop down and click “Sign in” to create the connection. Sign in with your admin account to create the connection.

With the trigger in place, we can now choose and operation or action to take once triggered. We won’t dive deep into Logic apps here but there is a lot of flexibility around the integrations and actions we can take as a response, for this example, I’ve chosen the Microsoft Teams action to post a simple message to a Teams channel.

When you’ve created and customized your playbook, hit save and head back to the Playbooks section of Azure Sentinel where you will see the new playbook.

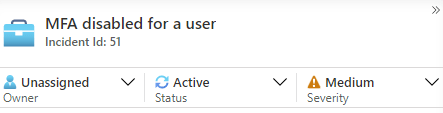
There are two ways we can initiate playbooks, we can either manually initiate as a response to an alert, or configure a specific type of alert to automatically trigger the playbook. To test, I have generated an alert by adding the rule “MFA disabled for a user” from the Azure AD connector. In the incidents blade, we can see two alerts from that rule.

If we click “View full details” on the incident, we can then see the details of the incident along with the alert that triggered it. We also have the option here to view playbooks.

Clicking “View playbooks” brings us to the playbooks we have available and we can click “Run” to kick off any playbooks we have in place.
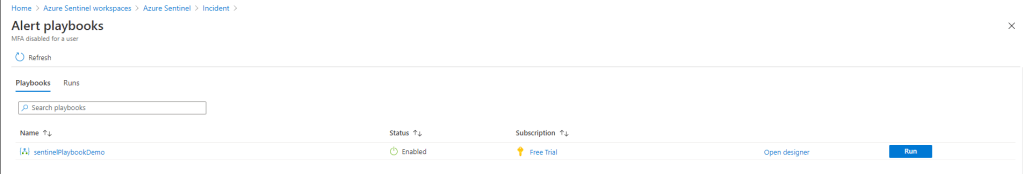
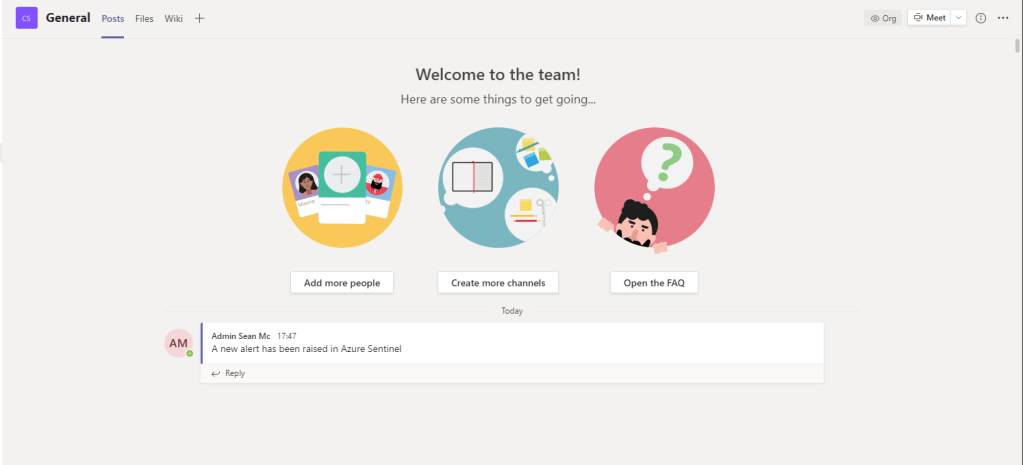
Once our test playbook runs, we can see that our message was posted into the Teams channel we specified, great! This is a very basic playbook with not much real world benefit but we can get much more complex through Logic Apps to automate some really cool functionality.
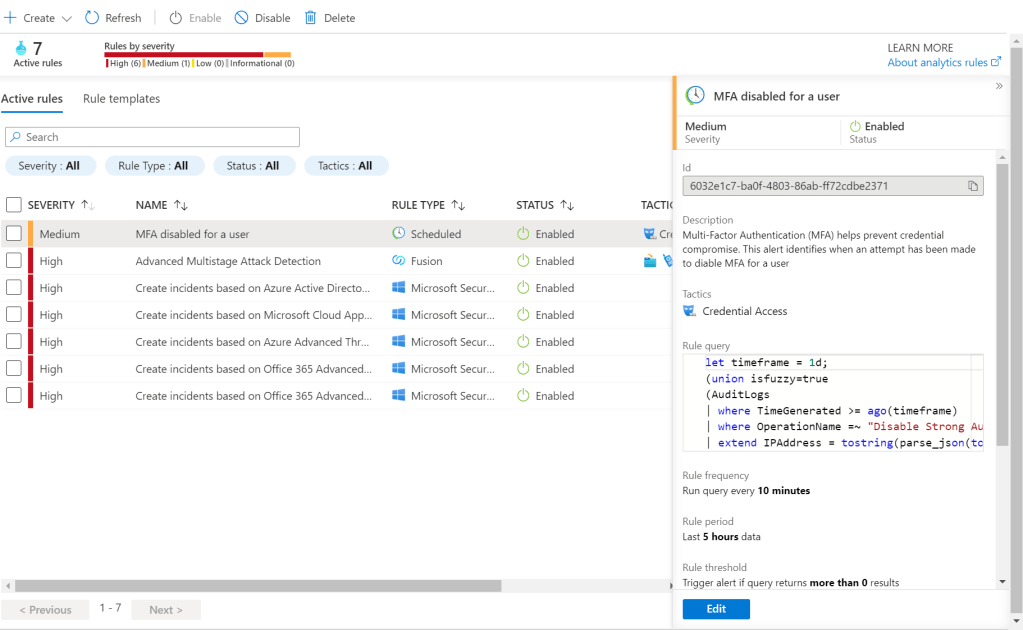
Running playbooks manually is nice, but on a large scale, we don’t want to manually start our playbooks for every incident. To automate a response we need to modify the analytics rules which trigger our alerts. To do this, navigate to the “Analytics” blade and select a rule to automate a response to. If you don’t have any rules created, you can create one following the steps outlined here.
I created a rule based on the Azure AD rule template “MFA disabled for a user” earlier so I’ll use that. Once your rule is in place, click on it and hit “Edit” in the right pane.
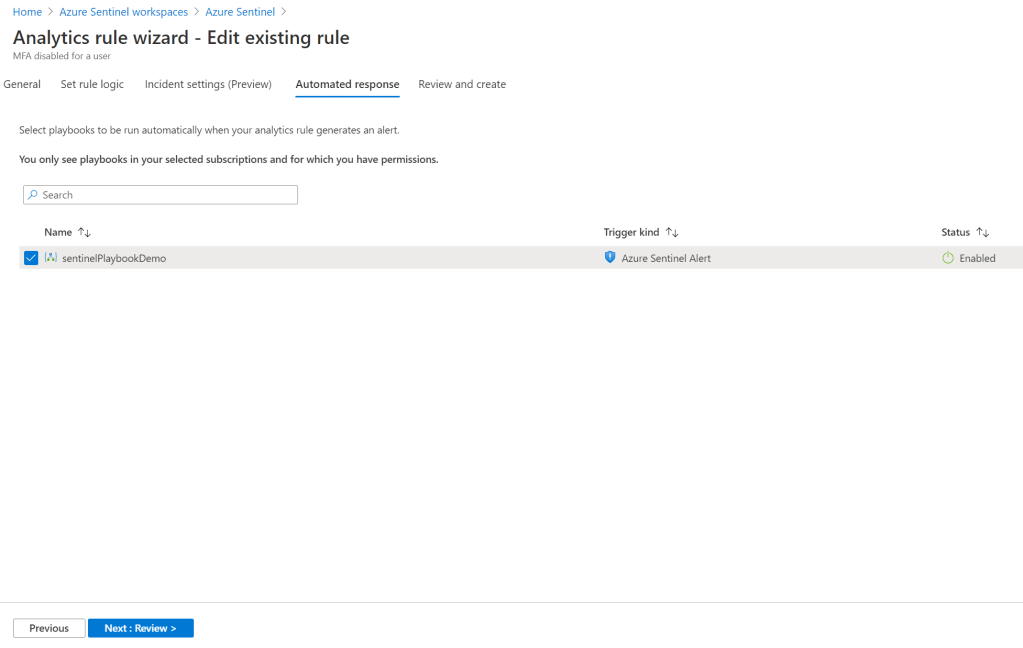
In the rule editor, we can modify the settings of the rule including the query that is used to detect and trigger alerts. Navigate to the “Automated Response” page and select the playbook you want the alerts to trigger.
Next go to the “Review and Create” page where the rule will be validated, under the Automated Response area, you should see your selected playbook. Once the rule is validated, click save. Again, the rule I’ve created is not really fit for production, I’m just using it to generate alerts but you can get quite complex with rule creation and really tailor the alerting to your requirements.

With the automated response configured, I’ve generated another alert for disabling MFA and we can see that our playbook has sent another notice to Teams automatically when the alert was triggered.


Manage and Monitor Azure Sentinel
Now that we’ve seen some alerts be generated and looked at building out Playbooks, let’s dive deeper into how we can manage and monitor Azure Sentinel on a daily basis. First, let’s look at a quick breakdown of the different sections of the Sentinel workspace. In the navigation pane we can access the following options:
Overview
This gives us a quick dashboard showing the alert and event volume over time across all of our data sources. Here we can get an at-a-glance summary of our workspace.

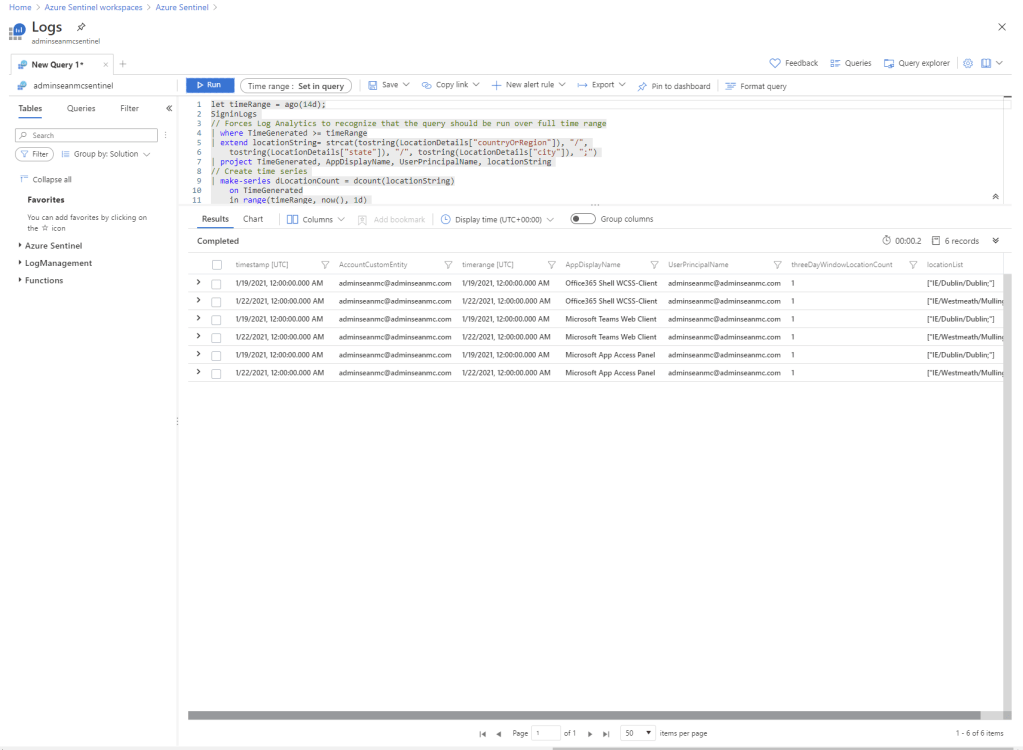
Logs
Here we can run queries against our Log Analytics workspace underpinning Azure Sentinel.

News & Guides
This section provides useful news around Azure Sentinel updates along with a “get started” page to help with setup.

Incidents
Here we can see a filterable list of incidents in our workspace, we can assign an incident to an admin to resolve, update the status of the incident (New, Active, Closed) and update the severity if required.

We can also view the details of an incident to see:
- The alerts associated with the incident
- Bookmarks we have created through the Hunting tool
- Entities that are associated with the incident
- Any comments we have added to the incident
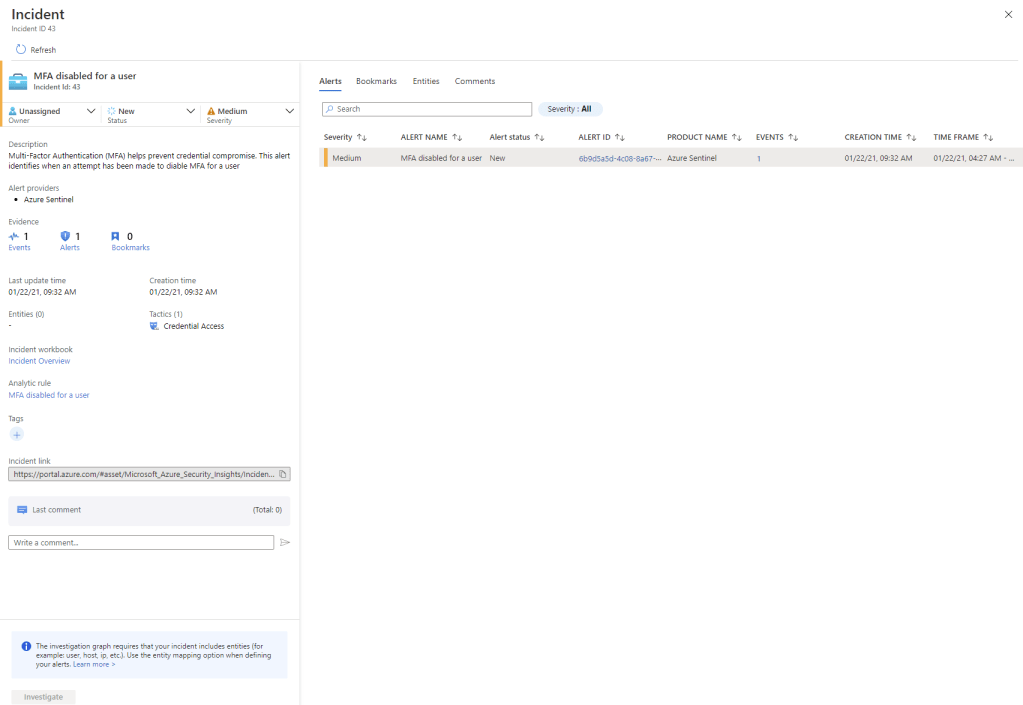
We can use the “investigate” option to view a map of the objects and relationships in the incident, this is also informed by any entity relationships mapping we created in our Analytics rule along with Azure AD integration.

Workbooks
We looked at creating workbooks in the previous post. Workbooks allow us to access and create visualizations of the activities in our environment, helping to provide easy correlation and a high-level of activities across single or multiple data sources.


Hunting
The Hunting page allows us to user pre-created or custom queries to search for particular behaviour in our environment. For example, looking at Azure AD related activities, we can very quickly use the “Anomalous sign-in location by user account and authenticating application” to query anomalous sign-in attempts in Azure AD.
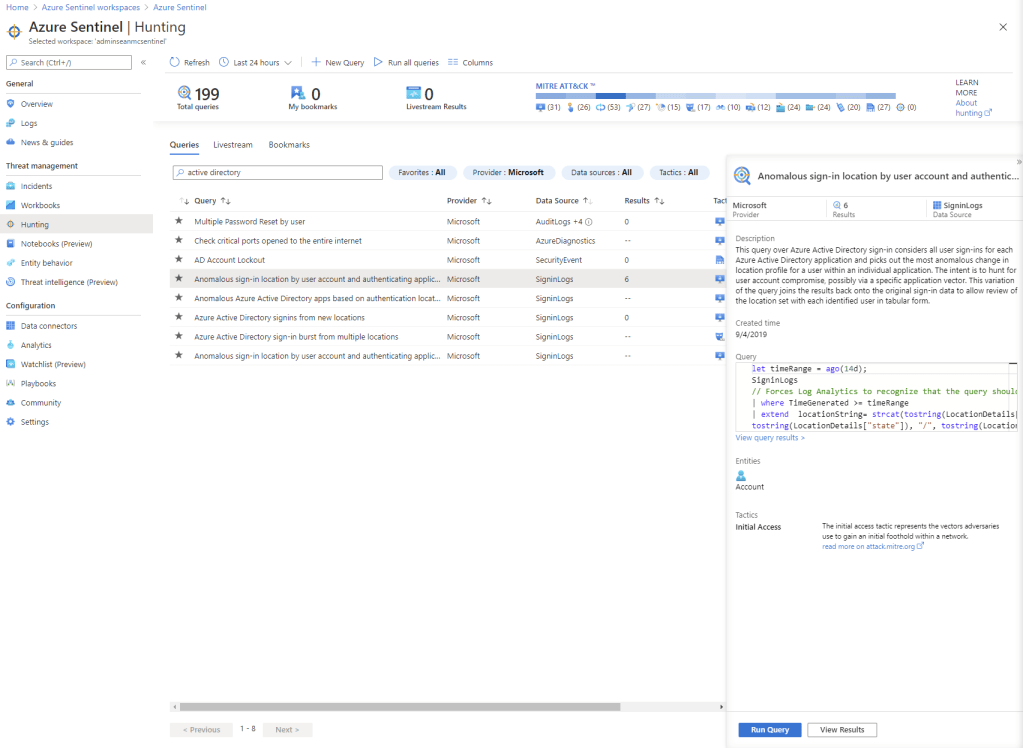
We can then create alert rules, export, copy etc. based on the result of our hunting queries. We can also add bookmarks to save and tag results that we want to keep track of.

Entity Behaviour
In the Entity Behaviour section, we can search for specific entities such as users, IP addresses, hosts to view all of the events, incidents and any other details associated with the entity. This becomes more powerful the more systems are onboarded to Sentinel.


Data Connectors
In the Data Connectors page we can onboard systems to Azure Sentinel from the list of provided native connectors. We’ve looked at adding connectors in a previous post.

Analytics
In the Analytics page we can configure Analytics Rules to allow us to trigger alerts based on specific triggers and behaviour. We can create custom rules or use/customise the provided templates.

Playbooks
We’ve detailed creating playbooks above, in this section we can create and modify any playbooks in out workspace.
Community
Community is a link to the external GitHub open source community where we can find community created content that we can use in Sentinel.


Settings
On the settings page we can review pricing, modify Azure Sentinel settings such as enabling behaviour analytics etc. We can also remove Azure Sentinel from here.

Respond to Threats in Azure Sentinel
We’ve looked at running playbooks and automating them to respond to incidents in Sentinel, we can also manage our incidents as they are raised. On the Incidents page, we can assign an incident to a particular user so they can investigate it.
We can then filter by owner to see our open incidents.

Then we can set the status of the incident to active and begin our investigation using the tools described above. We can add comments tags etc as we go and when we are happy the incident has been addressed, we can set the status to closed.

Summary
This has been a high level overview of Azure Sentinel particularly from a Microsoft 365 / Azure AD perspective. There is a lot of depth and power in what Sentinel can provide to an organization, particularly large organizations with disparate data sources. What we’ve covered here will provide enough context to meet the Microsoft 365 aspect of Sentinel but if you are interested in exploring further, the below links are a great place to get started.
Azure Sentinel uncovers the real threats hidden in billions of low fidelity signals (microsoft.com)
Quickstart: Onboard in Azure Sentinel | Microsoft Docs
Quickstart: Get started with Azure Sentinel | Microsoft Docs
Tutorial: Run a playbook in Azure Sentinel | Microsoft Docs
Connect data sources to Azure Sentinel | Microsoft Docs
Use entity behavior analytics to detect advanced threats | Microsoft Docs

Pingback: Study Guide Series – Exam MS-500: Microsoft 365 Security Administration – Sean McAvinue